
|
|
An Introduction to MATLAB
MATLAB is a mathematical software package which utilises matrix manipulation to perform complex numerical calculations. Unlike Mathematica or Maple, it is not a computer algebra system, so cannot compute symbolic mathematics unless an appropriate toolbox (e.g. the Symbolic Math Toolbox, which can be purchased from The Mathworks) is added to facilitate this.
MATLAB includes an extensive help window, which can be activated by typing
demos
in the command window followed by pressing the . After a short wait, the help window appears. This includes 'Contents', 'Index', 'Search', 'Demos' and 'Favorite' tabs. Problems can often be solved quickly through browsing this facility. Once the name of any required command is known, it is possible to get immediate help information for this command by entering help followed by the command name, e.g.
help sin
SIN Sine.
SIN(X) is the sine of the elements of X.
MATLAB always prints commands in UPPER case, even though they are inputted in lower case. This is because the command window would recognise and attempt to execute each command that appeared in the help output. This example has also highlighted the fact that MATLAB carries out its calculations on vectors ('elements of X').
MATLAB is a numerical computation package. It requires numbers with which to carry out computations. A s a result, expressions such as are meaningless to MATLAB unless it knows what actually represents.
Upon opening MATLAB, we are faced with a command window. If we enter
y=2*x
followed by the key the error message
??? Undefined function or variable 'x'.
is returned. To carry out a computation such as we first, therefore, need to decide a value for x and type this into the command window
x=2
followed by the The screen confirms that x has been assigned the value 2.
Then, enter
y=2*x
MATLAB confirms that y has been assigned the value 4.
If we re-enter a new value for x , say
x=3
MATLAB displays the new value. If we enter
y
into the command window, it shows that y= 4.
Re-entering
y=2*x
gives the new value for y. Clearly, MATLAB does not carry out the computation until it has been re-entered in the command window.
To calculate powers of a number, MATLAB uses the "^" sign. To calculate we enter
y=x^3
This gives the result y=27 , since the last value entered for x was 3.
To calculate roots of a number, use the fact that can also be written as .
Enter
a=27
Now enter
y=a^1/3
The answer given is y = 9 . This is (hopefully!) not the answer we wanted. MATLAB has interpreted y=a^1/3 as
To give the correct answer, the fraction needs to be entered in brackets:
y=a^(1/3)
This gives the answer 3 as expected.
The transcendental number is represented by pi . Entering
pi
into the command window gives an output
pi=3.1416. MATLAB has associated pi with a number and rounded this to 4 decimal places.
Entering
format long
pi
returns the output 3.14159265358979 i.e. to 14 decimal places. Entering
format short
returns us to the default setting of 4 decimal places.
Conversely, if we enter
e
the response given by MATLAB is
??? Undefined function or variable 'e'.
This is because the exponential is only defined by the function 'exp'. We can therefore assign a value for e by entering
e=exp(1)
which is the equivalent of . The response confirms this:
e =2.7183
To produce a matrix to look like this
,
in the command line window, type
A=[ 1 2 3 ; 4 5 6 ; 7 8 9 ]
separating each entry by a space, then press the key. Each semi-colon ";" tells MATLAB that the next entry is to be placed on a new line within the brackets. If the commands have been entered correctly, MATLAB will display the desired matrix on the screen. Note that MATLAB is case sensitive! A is NOT the same as a.
If a mistake has been made, MATLAB will display a red error message. For example, if we enter
A=[ 1 2 3 ; 4 5 6 7 8 9 ]
MATLAB will output
??? Error using ==> vertcat
CAT arguments dimensions are not consistent.
It may not be obvious from the error message what error has been made. However, upon inspection of the original command, it is easy to see that a ";" has been omitted between the 6 and the 7. The error message is pointing out that the original command is attempting to construct a matrix with 3 entries in the first row and 6 entries in the second.
If an error is made, rather than re-typing the whole command, it is much easier to press the up arrow cursor key to retrieve the original command then simply add the semi-colon in the correct position. Note that it is not necessary to move the cursor to the end of the command before pressing the key
If it is not required to print the output on screen, add a further semi-colon at the end of any command thus
A=[ 1 2 3 ; 4 5 6 ; 7 8 9 ] ;
This is particularly desirable when the output is large.
By clicking on the Workspace tab in the window to the left of the command window, it is possible to view all of the objects that have been created in the MATLAB session so far. If A has been entered correctly, the window will show A in the name column and [ 1 2 3 ; 4 5 6 ; 7 8 9 ] in the value column.
If a new matrix
B=[ 1 2 3 4 ; 5 6 7 8 ; 9 10 11 12 ; 13 14 15 16 ] ;
is entered and the Workspace window is checked, B is listed as < 4x4 double > which is the standard form for all matrices larger than in size.
The Workspace window is a powerful tool when looking for the source of errors. One of the most common errors occurs when an attempt is made to multiply two matrices with incompatible inner dimensions. It is a relatively simple matter to check the dimensions using the Workspace window.
Addition and subtraction of matrices is carried out using the standard + and - operators:
A+A
A-A
Notice that although you are required to enter matrices using square brackets, MATLAB output does NOT include them!
Whereas a computer algebra system represents a polynomial such as explicitly, MATLAB uses a vector of coefficients to represent a polynomial. In this case the vector is . To find the roots of a polynomial in MATLAB, the function 'roots' is used:
p=[1 -3 2];
roots(p)
ans =
2
1
The roots can also be found by entering the polynomial vector directly into the roots function:
roots([1 -3 2])
ans =
2
1
Note that omission of square brackets within the roots function results in the following error message:
roots(1 -3 2)
??? roots(1 -3 2)
Error: ")" expected, "numeric value" found.
It is also possible to find the coefficients of a polynomial given the roots, using the 'poly' function:
poly([-2 2])
ans = 1 0 -4
Note that the second entry of the vector is zero, indicating that the required polynomial with roots -2 and 2 is .
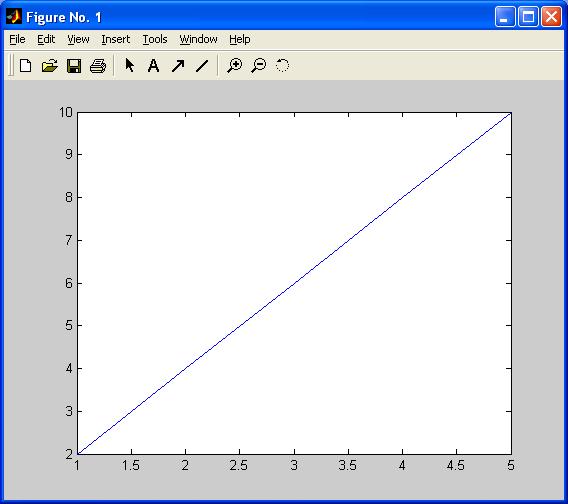
MATLAB plots graphs using vectors of coordinates. A simple illustration is given by creating 2 vectors each with 5 entries and assign them to the letters 'x' and 'y' , then plotting x versus y:
x=[1 2 3 4 5];
y=[2 4 6 8 10];
plot(x,y)
We see a graph like this:
|
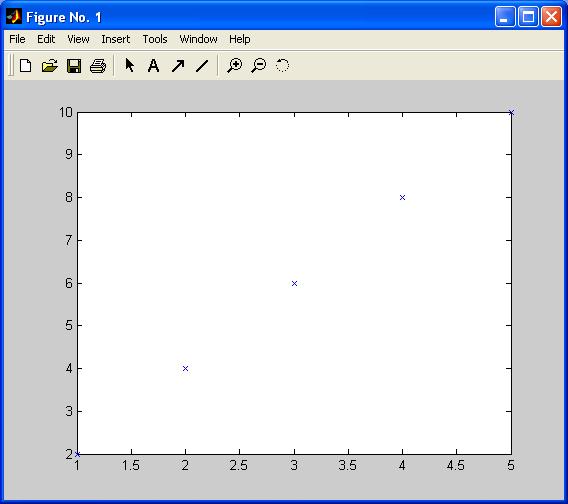
The range along the x-axis is the same as that of the x vector. Similarly, the range along the y-axis matches that of the y vector. By default, MATLAB has joined each of the points with a blue line. If we want to see only the points that have been indicated by the co-ordinates, the plot function needs to be modified slightly:
plot(x,y,'x')
What now appears is this:
|
Each of the co-ordinates (1, 2), (2, 4), (3, 6), (4, 8), (5, 10) has been plotted with a blue 'x'. Blue is the default colour for plotting. You will notice that the line describes the function for .
An alternative way of producing the same graph is to input
x=[1 2 3 4 5];
y=2*x;
plot(x,y,'x')
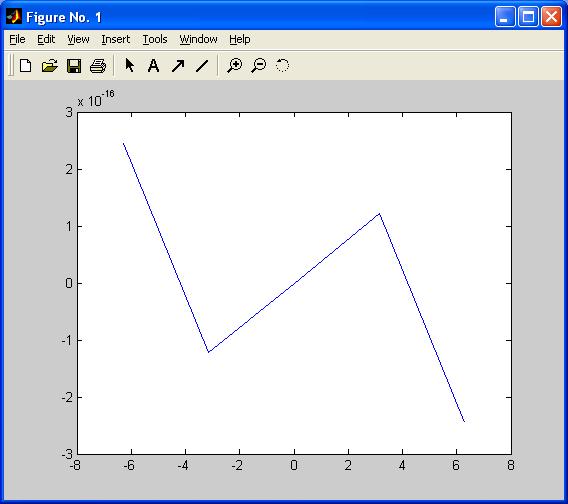
This example shows how we need to approach graphing functions of one variable in MATLAB. First produce a vector of values for the input variable, then calculate the output values using either a user designed function (e.g. multiply by 2) or an inbuilt MATLAB function (e.g. 'sin' , 'exp') and assign these to a suitable name (e.g. 'y', 'output', etc). Finally, use the 'plot' command to produce the graph. For example, plot .
x=[-2*pi -pi 0 pi 2*pi];
y=sin(x);
plot(x,y)
|
This is not what we wanted! 5 points is clearly not enough, so we cannot reproduce a sine wave. Also, at each of the points, we know that takes the value 0, although MATLAB, working to finite precision, produces outputs around To produce something that looks like a sine wave, we need extra points. Here are two ways of producing a suitable vector.
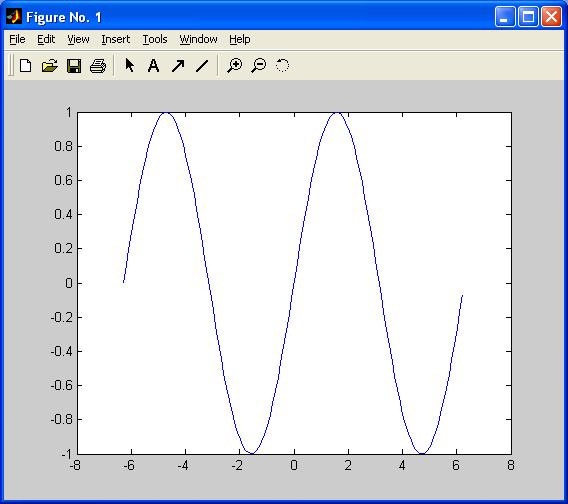
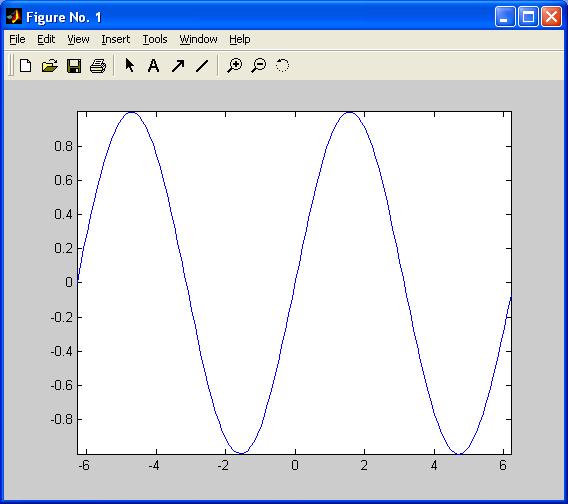
x=-2*pi:0.1:2*pi;
produces a vector with first element equal to -2*pi, then each successive element 0.1 greater than the previous element, finishing with a final element less than . This particular vector has 126 elements. Now apply the sine function and graph the result:
y=sin(x);
plot(x,y);
|
Note that MATLAB extends the plot window to either side of the range of our graph, to the nearest even integer values, -8 and 8. To prevent this, input
axis tight
to produce
|
The graph now fits exactly to the plot window. If, instead of using increments of 0.1 in the -vector we want to create a vector with a desired number of equally spaced elements, the command 'linspace' can be used:
x=linspace(-2*pi,2*pi,500);
produces a vector with 500 elements, first element , final element , with an intermediate 498 equally spaced elements. Then enter
y=sin(x);
plot(x,y)
to produce another sine wave, visually similar to the first one we produced, only this time using 500 points instead of 126.