![Problem 1 : Let   f (x) = f (x, y) = xy/((xy + 1)^(1/2) - 1)  ( ... ; the  region  x∈[0, 100],   y∈[0, 200] . ](HTMLFiles/index_2.gif) 
 ![f[x_, y_] := (x * y)/((x * y + 1)^(1/2) - 1)](HTMLFiles/index_3.gif) 
  
In[49]:=
 ![∂_x f[x] Simplify[%]](HTMLFiles/index_5.gif) 
Out[49]=
  
Out[50]=
  
In[55]:=
 ![∂_x f[x] ; Simplify[%]](HTMLFiles/index_8.gif) 
Out[55]=
  
In[53]:=
 ![∂_ (x, x) f[x] Simplify[%]](HTMLFiles/index_10.gif) 
Out[53]=
  
Out[54]=
  
  
 ![r1 = Limit[Limit[f[x, y], x0], y0]](HTMLFiles/index_14.gif) 
  
 ![r1 = Limit[f[x, y], x0]](HTMLFiles/index_16.gif) 
  
 ![(c) Draw a graph of the function  f (x, y)   in  the  region  x∈[0, 100],   y∈[0, 200] .](HTMLFiles/index_18.gif) 
In[33]:=
 ![RowBox[{Plot3D, [, RowBox[{f[x, y], ,,  , RowBox[{{, RowBox[{x, ,, 0.0001, ,,  , 100}], }}], ,, RowBox[{{, RowBox[{y, ,, 0.0001, ,,  , 200}], }}]}], ]}]](HTMLFiles/index_19.gif) 
 ![[Graphics:HTMLFiles/index_20.gif]](HTMLFiles/index_20.gif) 
Out[33]=
  
  
In[34]:=
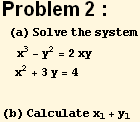
 ![f1 = x^3 - y^2 - 2 * x * y RowBox[{f2,  , =, RowBox[{x^2, +, 3 * y, -, 4.}]}]](HTMLFiles/index_23.gif) 
Out[34]=
  
Out[35]=
 ![RowBox[{RowBox[{-, 4.}], +, x^2, +, 3 y}]](HTMLFiles/index_25.gif) 
In[37]:=
 ![sol = Solve[{f10, f20}, {x, y}]](HTMLFiles/index_26.gif) 
Out[37]=
 ![RowBox[{{, RowBox[{RowBox[{{, RowBox[{RowBox[{y, , RowBox[{-, 77.86}]}], ,, RowBox[{x, ... Box[{RowBox[{y, , 1.13723}], ,, RowBox[{x, , RowBox[{-, 0.767005}]}]}], }}]}], }}]](HTMLFiles/index_27.gif) 
In[39]:=
 ![Print[x  + y  =, sol_〚1〛_〚1〛_〚2〛 + sol_〚1〛_〚2〛_〚2〛]         1    1](HTMLFiles/index_28.gif) 
 ![RowBox[{x  + y  =, , RowBox[{-, 62.4464}]}]          1    1](HTMLFiles/index_29.gif) 
Created by Mathematica (February 11, 2008)